Translate this page into:
Ultrasound liver elastography for the detection of liver fibrosis in patients with psoriasis and reactive arthritis on long-term methotrexate therapy: A cross-sectional study
2 Department of Gastroenterology, All India Institute of Medical Sciences, New Delhi, India
3 Department of Radiodiagnosis, All India Institute of Medical Sciences, New Delhi, India
4 Department of Pathology, All India Institute of Medical Sciences, New Delhi, India
5 Department of Biostatistics, All India Institute of Medical Sciences, New Delhi, India
Correspondence Address:
Sujay Khandpur
Department of Dermatology and Venereology, All India Institute of Medical Sciences, Ansari Nagar, New Delhi - 110 029
India
| How to cite this article: Khandpur S, Yadav D, Jangid B, Kumar A, S, Devasenathipathy K, Sharma R, Gupta SD, Kumar R, Kalaivani M. Ultrasound liver elastography for the detection of liver fibrosis in patients with psoriasis and reactive arthritis on long-term methotrexate therapy: A cross-sectional study. Indian J Dermatol Venereol Leprol 2020;86:508-514 |
Abstract
Background: Long-term low-dose methotrexate therapy is associated with liver fibrosis. Although liver biopsy is the gold standard for detecting fibrosis, it is an invasive procedure associated with morbidity and mortality risks. Hence noninvasive imaging techniques such as transient elastography (TE) and shear wave elastography (SWE) have been studied to measure liver stiffness.
Aims: To assess the utility of TE and SWE in detecting fibrosis in patients with psoriasis and reactive arthritis on long-term methotrexate therapy.
Methods: A cross-sectional prospective study was undertaken on 54 patients with psoriasis and reactive arthritis who had received ≥1.5 g of methotrexate. Various clinical and biochemical [fibrosis 4 index (FIB4), aspartate-transaminase-to-platelet ratio index (APRI)] parameters were calculated and liver stiffness measurement (LSM) was done with TE and SWE. The degree of steatosis was measured using controlled attenuation parameter (CAP). Liver biopsy was done when indicated and was interpreted by a pathologist blinded to clinical and imaging results.
Results: Fifty four patients with a mean age of 40.3 years and a male-to-female ratio of 5:1 were included. The mean cumulative methotrexate dose was 3.04 g. The median FIB4, APRI, and gamma-glutamyl transpeptidase-to-platelet ratio values were 0.75, 0.23, and 0.15, respectively. The median LSM for TE and SWE was 5.3 and 7.32 kPa, respectively. SWE and TE showed a weak positive correlation (r = 0.26, P = 0.053). The mean CAP was 217 dB/m (area under the receiver operating characteristic = 0.70). In the 19 of 26 cases whose liver biopsies could be assessed, only 4 (21%) showed F1 fibrosis (Ishak staging). The median LSM on SWE was significantly higher in patients with a cumulative methotrexate dose ≥ 4 g when compared with those with a dose <4 g (9.85 vs 7.1, P = 0.02). Other parameters did not correlate with TE and SWE.
Limitations: The small sample size and the low number of cases with significant fibrosis on histopathology were the major limitations of this study.
Conclusion: Histologically detectable LF is uncommon in patients with psoriasis and reactive arthritis on long-term methotrexate therapy. Both TE and SWE are good at detecting the absence of fibrosis in these patients. In our study, SWE and TE values did not correlate with clinical, biochemical, or histopathological parameters.
Introduction
Methotrexate is commonly used as a disease-modifying agent in severe psoriasis and reactive arthritis. Long-term low-dose methotrexate can cause liver fibrosis (LF) and parenchymal nonalcoholic steatohepatitis (NASH) like changes.[1] LF can be measured by biochemical parameters, imaging, or histopathology, with the latter being the gold standard.[1] However, liver biopsy has several disadvantages including sampling error, inter- and intra-observer variability on histological assessment, unsuitability for serial repetition, and associated morbidity and rarely, mortality.[2] Thus, there is a need for a sensitive and specific noninvasive technique to detect LF.
Transient elastography (TE) or fibroscan is based on shear waves implemented on a diagnostic ultrasound system and measures liver stiffness. It is rapid, accurate, reproducible and can assess a large sampling area. However it cannot measure liver stiffness over real time and is inaccurate in the presence of necroinflammatory changes or acute hepatitis. These drawbacks have been overcome by shear wave elastography (SWE), a newer technique which is performed in real time over a two-dimensional area guided by a higher frame rate (B-mode image) that gives both qualitative (color-coded images) and quantitative measures of liver stiffness. However the utility of SWE has not yet been established in detecting LF in patients with psoriasis or reactive arthritis. Thus, we undertook this study to assess the utility of ultrasound elastography (SWE and TE) in detecting LF in patients with psoriasis and reactive arthritis on long-term methotrexate therapy.
Methods
A prospective cross-sectional study was conducted in the Department of Dermatology of All India Institute of Medical Sciences, New Delhi, from March 2015 to June 2018 after obtaining approval from the institutional ethics committee. Patients with psoriasis and reactive arthritis who had received a total cumulative dose (TCD) of ≥1.5 g of methotrexate were included [Figure - 1]. After taking written informed consent, a thorough history and examination of all included cases was undertaken. Various indirect biochemical parameters for liver function assessment and biochemical indices for assessing LF [fibrosis 4 index (FIB4), aspartate-transaminase-to-platelet ratio index (APRI), gamma-glutamyl transpeptidase-to-platelet ratio (GPR)] were calculated.
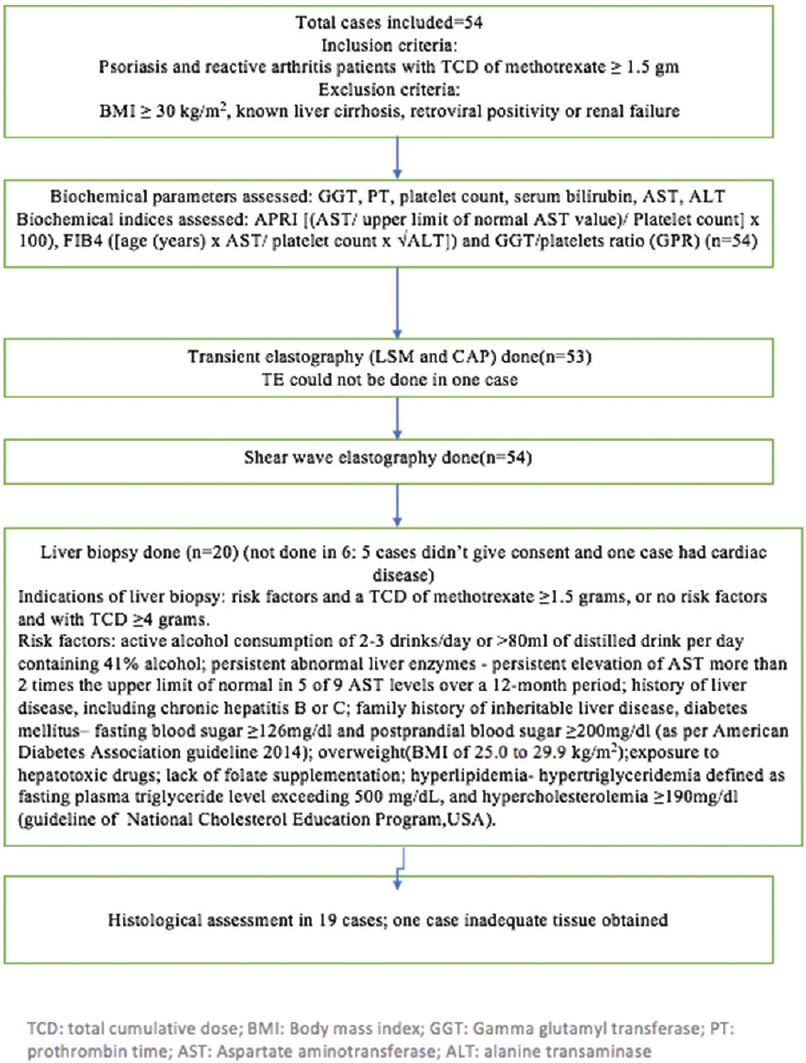 |
| Figure 1: Flowchart of the study |
TE was carried out using FibroScan® 502 Touch (Echosens, Paris, France) which provides a quantifiable estimate of liver stiffness [liver stiffness measurement (LSM); kPa] and steatosis by controlled attenuation parameter (CAP; dB/m).[3] For SWE, an Aixplorer ultrasound machine (Supersonic Imagine, France) with a convex transducer was used which provides quantitative information of tissue elasticity in kilopascals.[4] A single investigator performed both TE and SWE in all cases.
Liver biopsy was done in patients who had either risk factors and a TCD of methotrexate ≥1.5 g, or no risk factors and a TCD ≥ 4 g, [Figure - 1] and also in patients with a TE LSM >7.1 kPa and/or SWE LSM ≥8.6 kPa. An ultrasound-guided liver biopsy was performed by an experienced gastroenterologist using an intercostal approach. The same intercostal space that was used for TE and SWE measurements was used for biopsy. Histological assessment was done by expert pathologist who was blinded to the results of both TE and SWE. Liver biopsy staging was done according to the Ishak fibrosis score (0–6) and steatosis was measured according to the grading of nonalcoholic fatty liver disease (NAFLD).[5]

For statistical analysis, data were generated as a number (percentage) or median (minimum–maximum) as appropriate. The receiver operating characteristic (ROC) was used to find the predictive ability of SWE and TE against histopathology. The results were reported as area under the ROC (AUROC) [95% confidence interval (CI)]. Correlation between the two variables was calculated using Spearman's rank correlation coefficient. Categorical variables were compared between the groups using Fisher's exact test. Quantitative variables were assessed for normal distribution using the Shapiro-Wilk test and variables that did not follow the normal distribution were compared within the groups using Wilcoxon rank-sum test. P < 0.05 was considered statistically significant. Statistical analysis was carried out using Stata 12.0 (College Station, TX, USA).
Results
A total of 54 cases were recruited with a mean age of 40.3 years (range: 21–67 years) and a male-to-female ratio of 5:1. Forty-seven cases had psoriasis and seven cases had reactive arthritis. The mean TCD of methotrexate was 3.04 ± 1.5 g (range: 1.5–7.4 g). The clinical and demographic details of the cases are summarized in [Table - 1].

Of the biochemical parameters, the median FIB4, APRI, and GPR were 0.75 (range: 0.08–3.27), 0.23 (0.038–1.06), and 0.15 (0.027–1.03), respectively [Table - 2]. TE was done in 53 cases and the observed median (range) LSM and CAP values were 5.3 kPa (range: 2.7–17.8 kPa) and 217 dB/m (213.5–372 dB/m), respectively. Eight cases (15.1%) had a high LSM (i.e. >7.1 kPa) and 18 cases (33.9%) had CAP values more than 263 dB/m (indicative of significant steatosis). The median LSM of all 54 patients who underwent SWE was 7.32 kPa (range: 4.75–15.85 kPa), with 15 (27.8%) patients having value >8.6 kPa suggestive of LF [Table - 2]. The LSM values of SWE and TE showed only a weak positive correlation (r = 0.26, P = 0.053).

Liver biopsies were undertaken in 20 of 26 cases in whom indicated and could not be assessed in one case [Figure - 1]. Four of the 19 biopsies (21%) showed F1 fibrosis on histology according to Ishak LF staging (F0–F6) with a median TCD of methotrexate of 2.2 g (range: 1.7–5.5 g). The remaining 15 (79%) liver biopsies showed no fibrosis (F0) and had a median TCD of 4.16 g (range: 1.56–7.4 g). Steatosis was seen in 10 cases (52.6%), of which S1 and S2 were seen in 4 cases each (21% each) and S3 in 2 cases (10.5%). A NAFLD activity score score of more than 5 (indicative of NASH) was seen in 3 (15.8%) of the 19 biopsies [Table - 3].

An attempt was made to correlate the biochemical parameters (FIB4, APRI, GPR) and LSM values of TE and SWE with fibrosis on liver biopsy. Although there was trend towards slightly higher values in patients with fibrosis (except FIB4 and LSM values of TE) this did not attain statistical significance. [Table - 4]. The predictive ability of both SWE and TE in identifying fibrosis was low - the AUROC (95% CI) was 0.48 (0.22–0.74) and 0.41 (0.16–0.80), respectively. There was a weak correlation between the LSM values of TE and SWE in cases with and without fibrosis (F1 vs. F0) but this was not statistically significant (r = 0.26, P = 0.6 for F1 and r = 0.23, P = 0.41 for F0).

A TCD cutoff of ≥4 g of methotrexate was used for comparing various parameters. The SWE LSM values were significantly higher (9.85 vs 7.1 kPa, P = 0.02) in patients with TCD ≥4 g as compared with those with TCD <4 g, The LSM values of TE were also higher among patients with TCD ≥ 4 g, but this was not statistically significant (5.4 vs 5.25 kPa) [Table - 5].

LSM cutoff values of >7.1 on TE and > 8.6 kPa on SWE are generally used for diagnosing significant fibrosis. Of the eight cases with LSM > 7.1 kPa on TE only four had LSM > 8.6 kPa on SWE (P = 0.45) and none of these patients had fibrosis on histopathology. All four cases who showed F1 fibrosis on histopathology also had >8.6 kPa LSM on SWE (P = 0.53).
An AUROC of 0.70 [standard error (SE): 0.12, 95% CI: 0.45–0.94] was observed when comparing steatosis by the CAP values on TE with histopathology. The CAP cutoff value obtained was 203 dB/m with a sensitivity of 80% and specificity of 55.56%. CAP values ≥203 dB/m were significantly correlated with NAFLD activity score (P = 0.042).
Discussion
There is an increased risk of LF or cirrhosis with the use of long-term low-dose methotrexate.[6],[7] It is now recognized that liver toxicity is related to other comorbidities such as diabetes, morbid obesity, or chronic alcoholism than to methotrexate alone.[8] The proposed mechanism of LF with low-dose methotrexate is through production of extracellular adenosine which is a profibrotic agent.[1]
Methotrexate causes both portal fibrosis and steatosis. Methotrexate induced fibrosis is generally graded using the Roenigk pathological grading scale[9] although other grading systems such as Metavir (F0–F4) and Ishak (F0–F6) have also been used.[3] The Metavir grading has often been used in previous studies of TE and SWE. However, we predicted a lower level of fibrosis in our patients and so preferred the Ishak grading as it is a more elaborate grading system (6 points) than Metavir (4 points) and could be expected to decipher subtle changes in fibrosis. We found mild fibrosis (F1 grade) in 4 of 19 (21%) patients. In a recent review, only 5% (range: 0%–33%) of patients on methotrexate were shown to develop significant hepatic fibrosis.[1]
We also did not find any correlation between the presence of fibrosis on histopathology with either the TCD of methotrexate or the presence of risk factors. Similar results were observed in a meta-analysis of 8 studies in 429 psoriatic patients on long-term methotrexate therapy in whom at least two liver biopsies had been done. In this analysis a 22% increased risk of “any fibrosis” and 9% increased risk of “significant fibrosis” was found with methotrexate use but there was no association with the TCD.[10]
Liver biopsy is the gold standard for diagnosing LF but has several limitations, including associated morbidity (1%) and mortality (0.01-0.1%).[2],[11] Noninvasive methods such as indirect and direct biochemical parameters and imaging techniques such as TE and SWE have also been used to assess LF. Conventional ultrasonography is useful in detecting steatosis, but is not helpful in detecting fibrosis until advanced cirrhosis has set in. Newer ultrasonographic methods such as TE and SWE utilize the velocity of low-frequency (50 Hz) elastic shear waves that traverse the liver parenchyma to calculate liver stiffness based on Young's modulus. SWE is superior to TE as it produces a 2D image using higher B-frame mode and gives both qualitative (color-coded images) and quantitative measures of liver stiffness.
Cheng and Rademaker and the Australasian Position Statement have both recommended TE as a routine investigation for monitoring methotrexate therapy, with 3 yearly monitoring if kPa <7.5, yearly if kPa >7.5, and a liver biopsy in cases with kPa >9.5.[1],[12] The advantages of TE include its noninvasive nature, low interobserver variability, and low failure rate (3.1%–4.5%).[13],[14] Generally, kPa values <5 suggest the absence of fibrosis while values of >7 kPa suggest advanced fibrosis in various chronic liver diseases.[1] In our study, the median LSM with TE was 5.3 kPa, indicative of no fibrosis, which was in accordance with the histopathology results. The TE LSM values did not differ significantly with the TCD of methotrexate, risk factors, or fibrosis stage (Ishak staging). We could not assess TE in one case due to nonavailability of the patient. A common reason for failure of TE is obesity, but the failure rate has reduced to less than 15% with use of the XL probe.[3] TE has been shown to have higher sensitivity and specificity in detecting cirrhosis rather than lower grades of LF.[1],[15] It reduces at lower grades of LF. In a Cochrane review of LF in alcoholic liver disease, the cutoff for F1, F2, F3, and F4 fibrosis (Metavir staging) was 5.9, 7.5, 9.5, and 12.5 kPa, respectively. For a cutoff of 5.9 kPa for F1 fibrosis, the sensitivity and specificity were 83% and 88%, respectively.[16] The use of fibroscan has reduced the need for liver biopsies for LF assessment in a majority of patients with hepatitis B virus infection.[17]
In an Asian study of 41 psoriasis patients on methotrexate, an AUROC of 0.78 and a sensitivity of 50% and specificity of 77% was noted with cutoff of 7.1 kPa for detecting significant LF (Metavir staging ≥ F2), while for detecting methotrexate-induced liver injury (Roenigk grade ≥3a) the sensitivity and specificity were 50% and 83.9%, respectively.[18] Only 9 (16%) of our patients had TE value >7.1 kPa reflecting the lower incidence of LF in our patients. Similar results were also obtained by Berends et al. in 20 psoriasis patients on methotrexate, where the TE values ranged from 3.3 to 18.4 kPa and TE was able to detect 88% of those without significant LF (Metavir stage < F2). This group found fibrotest, a biochemical test, to be more useful in predicting significant LF.[19]
SWE has not yet been studied in patients with psoriasis but there is a single study of 185 cases of rheumatoid arthritis in which the mean SWE value was observed to be 5.9 ± 1.3 kPa, significantly higher than in the control group (5.5 ± 1.2 kPa, P < 0.006).[20] In this study LF was noted in 9 cases (5%) using a cutoff of 8.6 kPa to define significant fibrosis. There was no correlation between the SWE values and TCD of methotrexate, but a positive correlation with high BMI was noted. A major drawback of this study was that no attempt was made to correlate fibrosis with histopathology.
In our study, the SWE values ranged from 4.75 to 15.85 kPa with a median of 7.32 kPa. Using cutoff of 8.6 kPa, 15 patients (27.8%) had significant liver stiffness which is much higher than in the previous study. We found significantly higher value of SWE in cases with ≥4 g of methotrexate (9.85 vs 7.1 kPa, P = 0.02). However, there was no correlation with risk factors or LF staging on histopathology (Ishak staging).
Although there are no studies comparing LSM between SWE and TE in either psoriatic patients or in patients on long term methotrexate therapy, such studies have been conducted in other chronic liver diseases. In 257 chronic hepatitis B patients, Zeng et al. found a good correlation between LSM with SWE and TE. The median SWE values for F0 and F1 were 6.0 and 6.6 kPa, respectively, and the TE values were 5.2 and 5.6 kPa. They found slightly higher values on SWE than TE for the same fibrosis stage.[21]
In our study TE and SWE showed a weak positive correlation (r = 0.26) which could be due to the small sample size. In all cases (with or without liver biopsy), the LSM values of SWE (median 7.32 kPa) were higher than TE (median 5.3 kPa). We also found higher but not statistically significant SWE LSM values in patients showing F1 fibrosis on histology (SWE for F0: 9.35 kPa vs F1: 9.47 kPa). With TE, on the other hand, marginally higher LSM values were observed in patients without fibrosis (TE for F0: 5.3 kPa and F1: 5.1 kPa). This apparent discordance could be due to small sample size, especially the number of cases with F1 fibrosis (four cases).
Paul et al. from India found a good correlation between SWE and TE (r = 0.52, P < 0.001) in 240 cases of chronic hepatitis B and C. The mean LSM values for F0 stage for SWE and TE were 5.0 and 5.1 kPa, respectively. They noted a higher accuracy in F3 and F4 than in F1 and F2 stages (Metavir stages) and felt that TE was better at differentiating F1 and F2 fibrosis than SWE (AUC: 0.84 vs 0.76). They observed a cutoff of 7 kPa for > F2 fibrosis for SWE and 9.7 kPa for TE.[4] Contrastingly, Poynard et al. found SWE to be better than TE in estimating liver stiffness as there was a lower impact of steatosis and necroinflammation on the former. 22
Apart from measuring liver stiffness, TE can also predict the degree of steatosis through CAP. This is beneficial in patients with psoriasis as they have a higher incidence of metabolic syndrome. The median CAP value in our study was 217 dB/m (AUROC = 0.70). We found a cutoff of 203 dB/m for detecting steatosis with a sensitivity and specificity of 80% and 55%, respectively. The CAP values also significantly correlated with NAFLD activity score. In an Indian study of 462 patients with chronic liver disease, the CAP values detected hepatic steatosis with good accuracy. The median CAP values for S0, S1, S2, and S3 steatosis were 206, 295, 320, and 349 dB/m, respectively. For estimation of ≥ S1, ≥S2, and ≥S3 using CAP, the AUROC was 0.879, 0.893, and 0.883, respectively.[23]
Both the imaging techniques (TE and SWE) are easily available throughout most centers in India. The cost incurred is similar to that in undergoing liver biopsy and histology.
Limitations
Of the 19 cases in which liver biopsy was performed, we found fibrosis in only 4 cases and that too only F1 (Ishak grading). Because imaging techniques such as TE and SWE are not good at differentiating lower grades of fibrosis (F1 and F2), we could not conclude on the utility of these techniques in detecting significant fibrosis and cirrhosis.
Conclusion
Histologically detectable LF is rare in patients with psoriasis and reactive arthritis on chronic methotrexate therapy. SWE and TE showed good correlation at detecting the absence of fibrosis in our subset of patients. The SWE and TE (LSM) values were higher in patients with TCD of methotrexate ≥4 g (P = 0.02). The SWE and TE values did not correlate with clinical, biochemical, or histopathological parameters. TE can also detect steatosis besides liver stiffness.
Declaration of patient consent
The authors certify that they have obtained all appropriate patient consent forms. In the form, the patients have given their consent for their images and other clinical information to be reported in the journal. The patient understands that name and initials will not be published and due efforts will be made to conceal identity, but anonymity cannot be guaranteed.
Financial support and sponsorship
Nil.
Conflicts of interest
There are no conflicts of interest.
| 1. |
Cheng HS, Rademaker M. Monitoring methotrexate-induced liver fibrosis in patients with psoriasis: Utility of transient elastography. Psoriasis (Auckl) 2018;8:21-9.
[Google Scholar]
|
| 2. |
Kremer JM, Alarcón GS, Lightfoot RW Jr., Willkens RF, Furst DE, Williams HJ, et al. Methotrexate for rheumatoid arthritis. Suggested guidelines for monitoring liver toxicity. American college of rheumatology. Arthritis Rheum 1994;37:316-28.
[Google Scholar]
|
| 3. |
Garg H, Aggarwal S, Shalimar, Yadav R, Datta Gupta S, Agarwal L, et al. Utility of transient elastography (fibroscan) and impact of bariatric surgery on nonalcoholic fatty liver disease (NAFLD) in morbidly obese patients. Surg Obes Relat Dis 2018;14:81-91.
[Google Scholar]
|
| 4. |
Paul SB, Das P, Mahanta M, Sreenivas V, Kedia S, Kalra N, et al. Assessment of liver fibrosis in chronic hepatitis: Comparison of shear wave elastography and transient elastography. Abdom Radiol (NY) 2017;42:2864-73.
[Google Scholar]
|
| 5. |
Goodman ZD. Grading and staging systems for inflammation and fibrosis in chronic liver diseases. J Hepatol 2007;47:598-607.
[Google Scholar]
|
| 6. |
Dahl MG. Methotrexate and the liver. Br J Dermatol 1969;81:465-7.
[Google Scholar]
|
| 7. |
Carneiro SC, Cássia FF, Lamy F, Chagas VL, Ramos-e-Silva M. Methotrexate and liver function: A study of 13 psoriasis cases treated with different cumulative dosages. J Eur Acad Dermatol Venereol 2008;22:25-9.
[Google Scholar]
|
| 8. |
Rodríguez-Zúñiga MJ, García-Perdomo HA. Systematic review and meta-analysis of the association between psoriasis and metabolic syndrome. J Am Acad Dermatol 2017;77:657-66.e8.
[Google Scholar]
|
| 9. |
Kalb RE, Strober B, Weinstein G, Lebwohl M. Methotrexate and psoriasis: 2009 National Psoriasis Foundation Consensus Conference. J Am Acad Dermatol 2009;60:824-37.
[Google Scholar]
|
| 10. |
Maybury CM, Jabbar-Lopez ZK, Wong T, Dhillon AP, Barker JN, Smith CH. Methotrexate and liver fibrosis in people with psoriasis: A systematic review of observational studies. Br J Dermatol 2014;171:17-29.
[Google Scholar]
|
| 11. |
Howlett DC, Drinkwater KJ, Lawrence D, Barter S, Nicholson T. Findings of the UK national audit evaluating image-guided or image-assisted liver biopsy. Part II. Minor and major complications and procedure-related mortality. Radiology 2013;266:226-35.
[Google Scholar]
|
| 12. |
Rademaker M, Gupta M, Andrews M, Armour K, Baker C, Foley P, et al. The Australasian psoriasis collaboration view on methotrexate for psoriasis in the Australasian setting. Australas J Dermatol 2017;58:166-70.
[Google Scholar]
|
| 13. |
Foucher J, Castéra L, Bernard PH, Adhoute X, Laharie D, Bertet J, et al. Prevalence and factors associated with failure of liver stiffness measurement using FibroScan in a prospective study of 2114 examinations. Eur J Gastroenterol Hepatol 2006;18:411-2.
[Google Scholar]
|
| 14. |
Castéra L, Foucher J, Bernard PH, Carvalho F, Allaix D, Merrouche W, et al. Pitfalls of liver stiffness measurement: A 5-year prospective study of 13,369 examinations. Hepatology 2010;51:828-35.
[Google Scholar]
|
| 15. |
European Association for Study of Liver, Asociacion Latinoamericana para el Estudio del Higado. EASL-ALEH clinical practice guidelines: Non-invasive tests for evaluation of liver disease severity and prognosis. J Hepatol 2015;63:237-64.
[Google Scholar]
|
| 16. |
Pavlov CS, Casazza G, Nikolova D, Tsochatzis E, Burroughs AK, Ivashkin VT, et al. Transient elastography for diagnosis of stages of hepatic fibrosis and cirrhosis in people with alcoholic liver disease. Cochrane Database Syst Rev 2015;1:CD010542.
[Google Scholar]
|
| 17. |
Goyal R, Mallick SR, Mahanta M, Kedia S, Shalimar, Dhingra R, et al. Fibroscan can avoid liver biopsy in Indian patients with chronic hepatitis B. J Gastroenterol Hepatol 2013;28:1738-45.
[Google Scholar]
|
| 18. |
Rongngern P, Chularojanamontri L, Wongpraparut C, Silpa-Archa N, Chotiyaputta W, Pongpaibul A, et al. Diagnostic performance of transient elastography for detection of methotrexate-induced liver injury using Roenigk classification in Asian patients with psoriasis: A retrospective study. Arch Dermatol Res 2017;309:403-8.
[Google Scholar]
|
| 19. |
Berends MA, Snoek J, de Jong EM, Van Krieken JH, de Knegt RJ, van Oijen MG, et al. Biochemical and biophysical assessment of MTX-induced liver fibrosis in psoriasis patients: Fibrotest predicts the presence and fibroscan predicts the absence of significant liver fibrosis. Liver Int 2007;27:639-45.
[Google Scholar]
|
| 20. |
Kim TY, Kim JY, Sohn JH, Lee HS, Bang SY, Kim Y, et al. Assessment of substantial liver fibrosis by real-time shear wave elastography in methotrexate-treated patients with rheumatoid arthritis. J Ultrasound Med 2015;34:1621-30.
[Google Scholar]
|
| 21. |
Zeng J, Zheng J, Huang Z, Chen S, Liu J, Wu T, et al. Comparison of 2-D shear wave elastography and transient elastography for assessing liver fibrosis in chronic hepatitis B. Ultrasound Med Biol 2017;43:1563-70.
[Google Scholar]
|
| 22. |
Poynard T, Pham T, Perazzo H, Munteanu M, Luckina E, Elaribi D, et al. Real-time shear wave versus transient elastography for predicting fibrosis: Applicability, and impact of inflammation and steatosis. A non-invasive comparison. PLoS One 2016;11:e0163276.
[Google Scholar]
|
| 23. |
Rout G, Kedia S, Nayak B, Yadav R, Das P, Acharya SK, et al. Controlled attenuation parameter for assessment of hepatic steatosis in Indian patients. J Clin Exp Hepatol 2019;9:13-21.
[Google Scholar]
|
Fulltext Views
5,913
PDF downloads
1,245


![[Figure - 1]](#fig_ijdvl_2020_86_5_508_286212_f1.jpg)
![[Table - 1]](#tbl_ijdvl_2020_86_5_508_286212_t2.jpg)
![[Table - 2]](#tbl_ijdvl_2020_86_5_508_286212_t3.jpg)
![[Table - 3]](#tbl_ijdvl_2020_86_5_508_286212_t4.jpg)
![[Table - 4]](#tbl_ijdvl_2020_86_5_508_286212_t5.jpg)
![[Table - 5]](#tbl_ijdvl_2020_86_5_508_286212_t6.jpg)